Arthur's Seat
Render
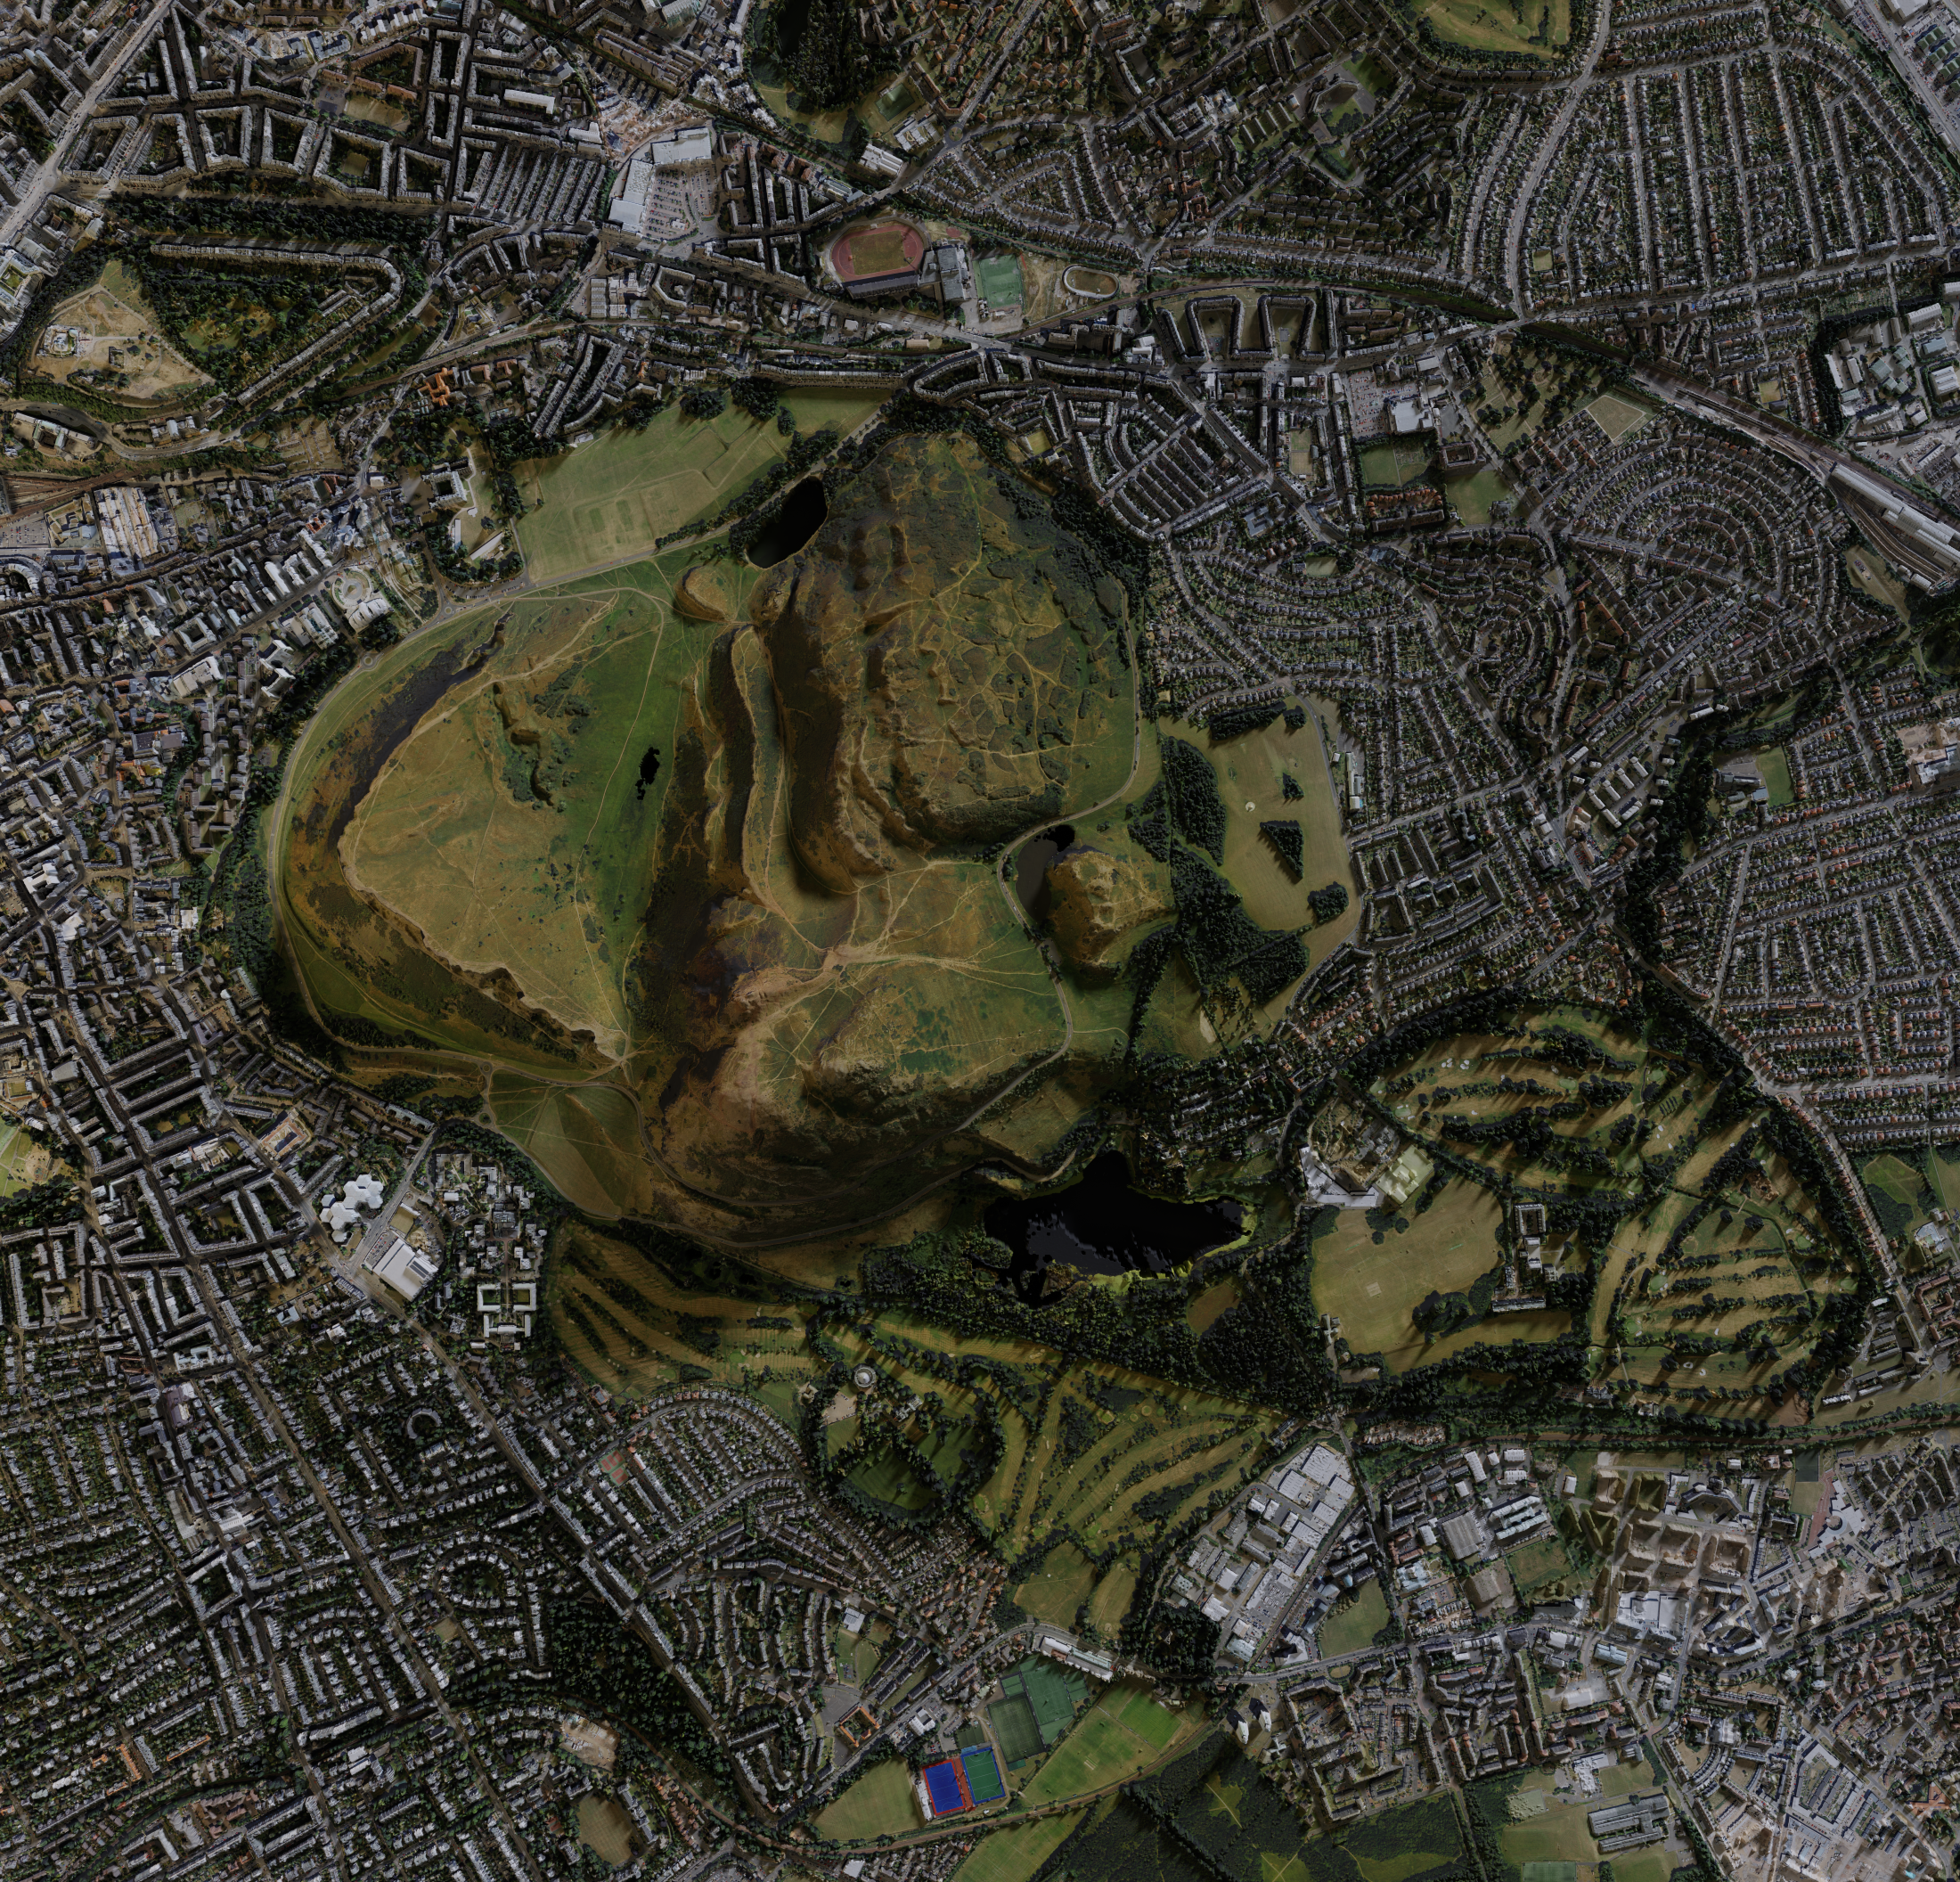
This render utilizes the open source 2m resolution Lidar data for the UK.
What captivates me about geospatial information is its power to transform data into
compelling visual narratives through maps. By integrating this data with popular 3D modelling software such as Blender we are able to create an
immmense range of visualisations, which I find a great outlet for excercising creativity.
The following content contains examples of when I have integrated 3D modelling techniques into both professional related projects (For my MSc)
and personal projects.
Within my MSc, the primary group project was named 'Capital Greenspace', where we were tasked with evaluating the relative ecological value of Edinburgh's urban greenspaces to identify key sites where investment would most benefit the community in locations of deprivation. I was voted Team Lead to direct this project. The animation below was developed in the later stages of the project during website development, where I decided to use Blender to provide a quick overview of the geospatial analysis.
This render utilizes the open source 2m resolution Lidar data for the UK.
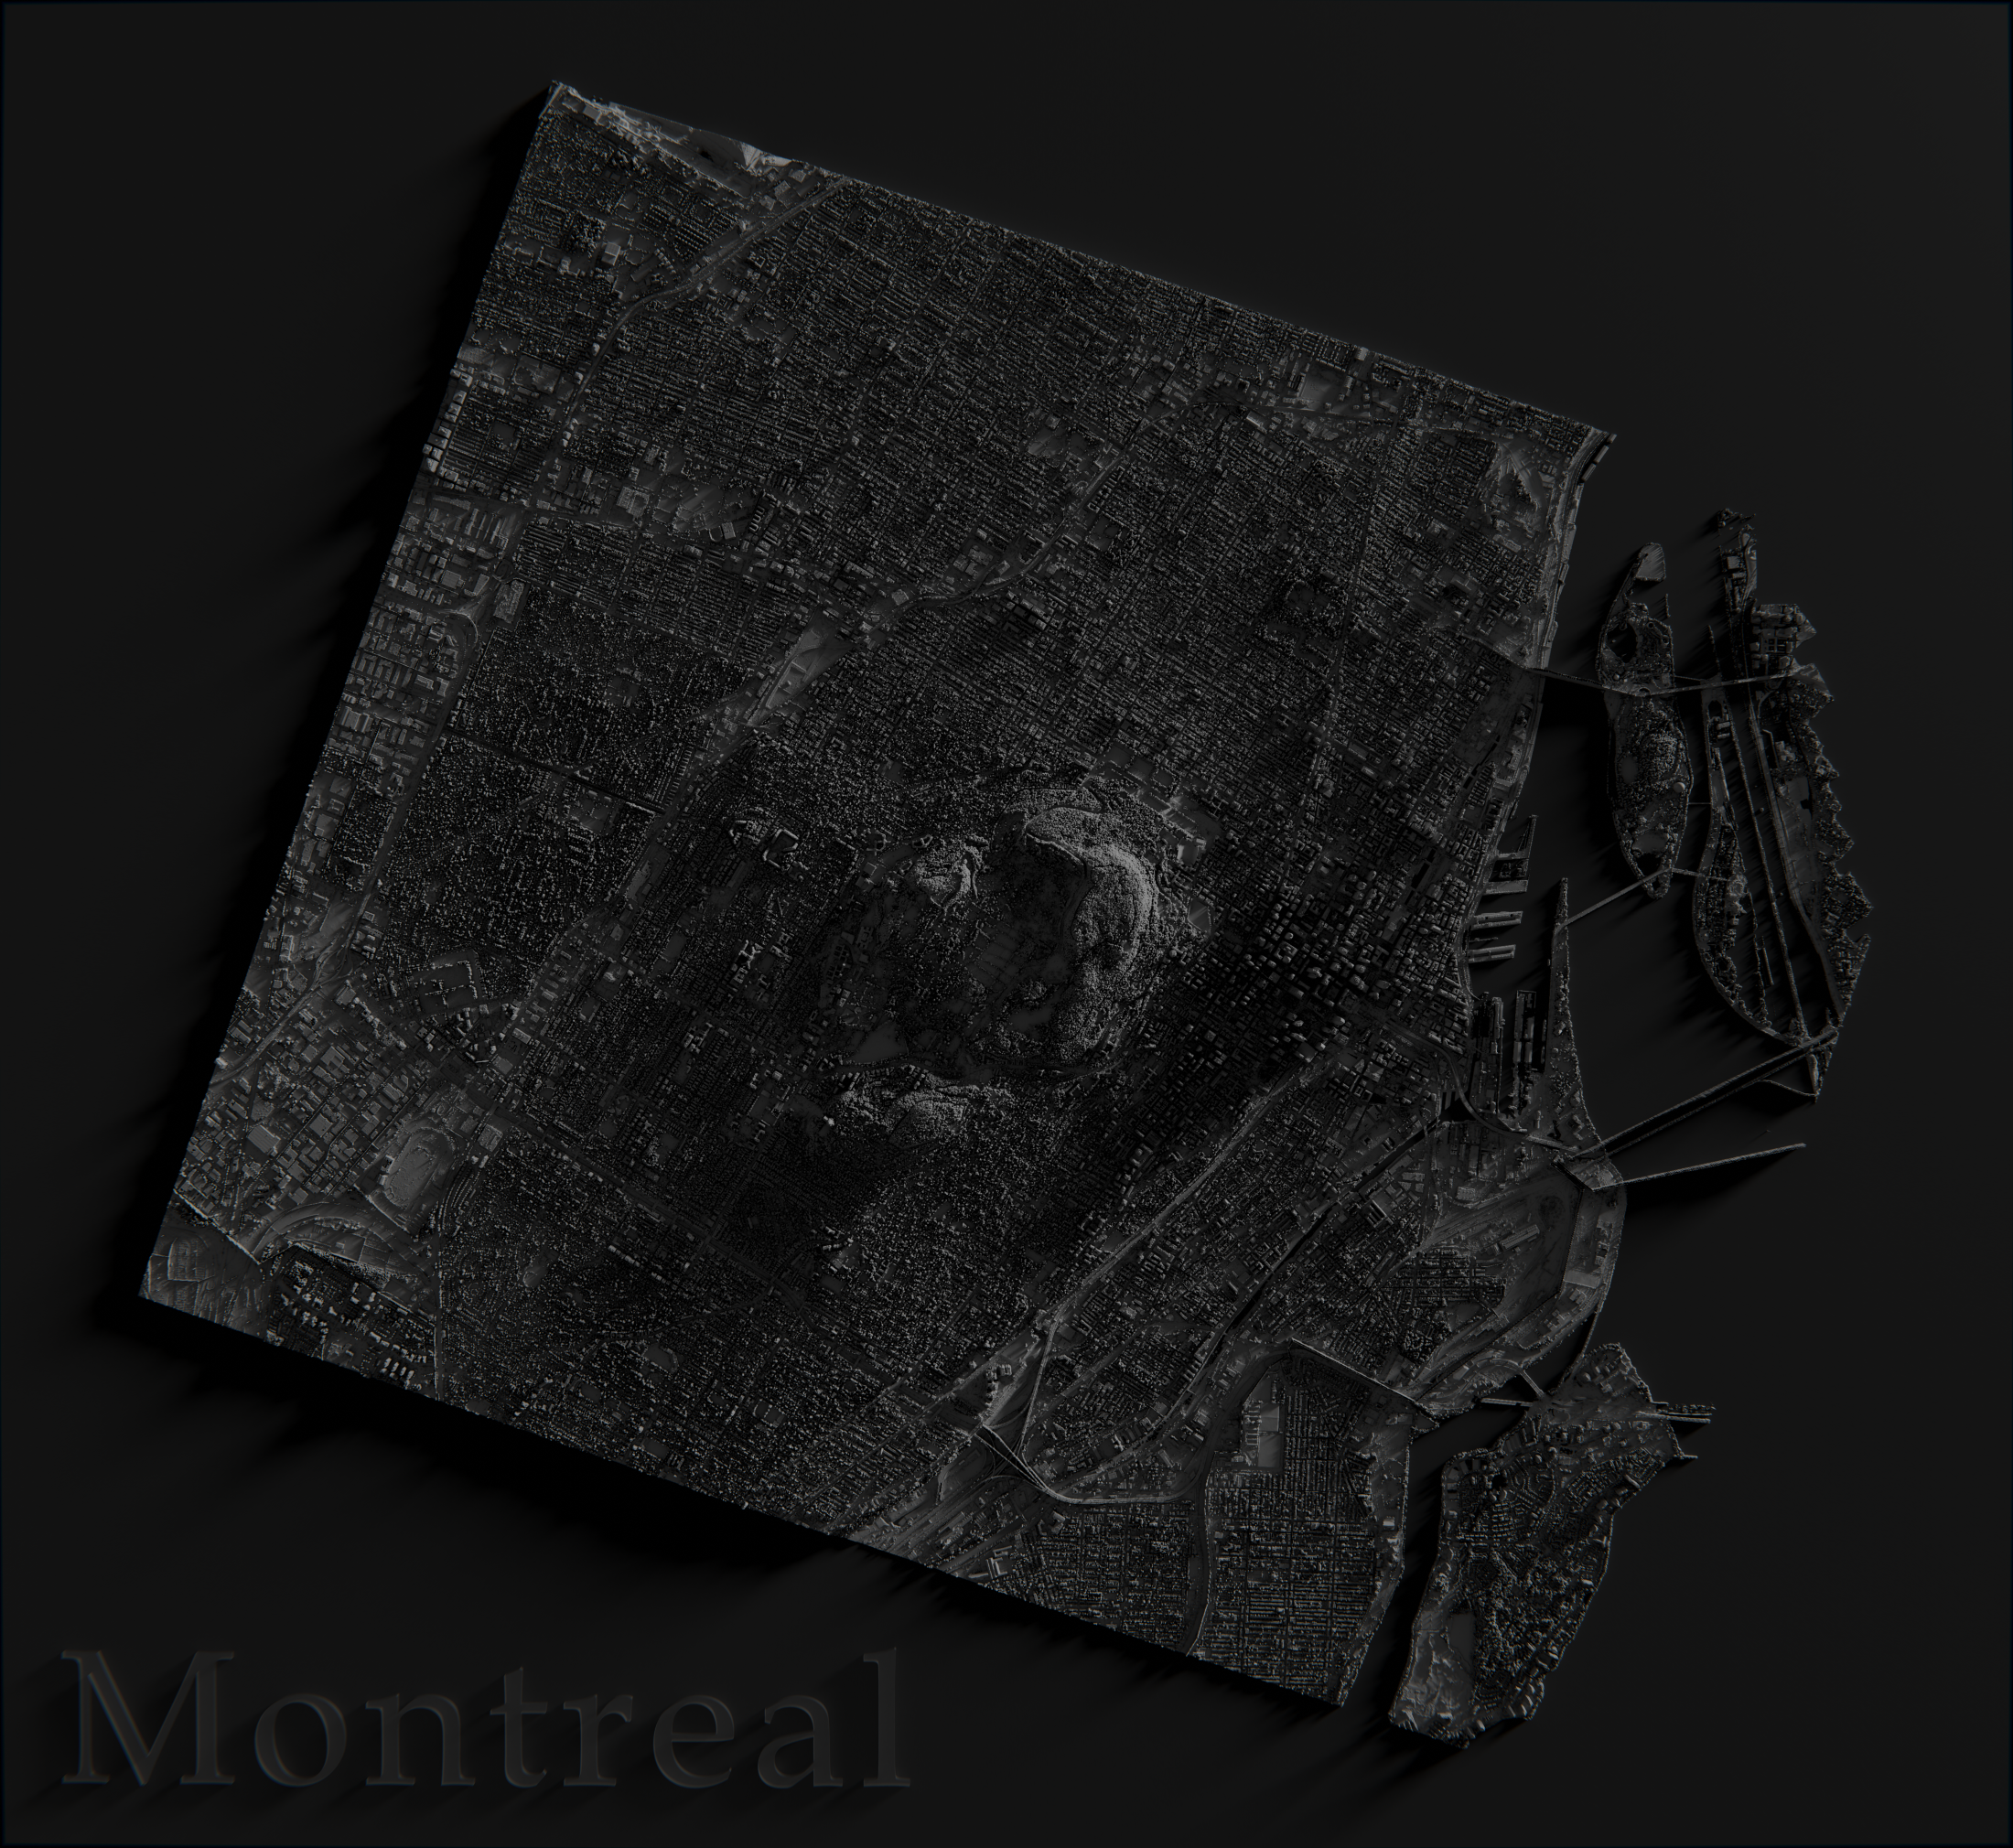
This render uses the open source Lidar data for Canada, extracting a subset of Montreal.
This short animation highlights the huge change in lake surface area for the Tonle Sap and flooding along the Mekong in Cambodia as the season shifts.

This render utilizes the open source Lidar data for Canada, where I have extracted the Quebec region, exaggerated the elevation and applied a colour palette based on elevation.

This render utilizes the 2m open source Lidar data for the UK.
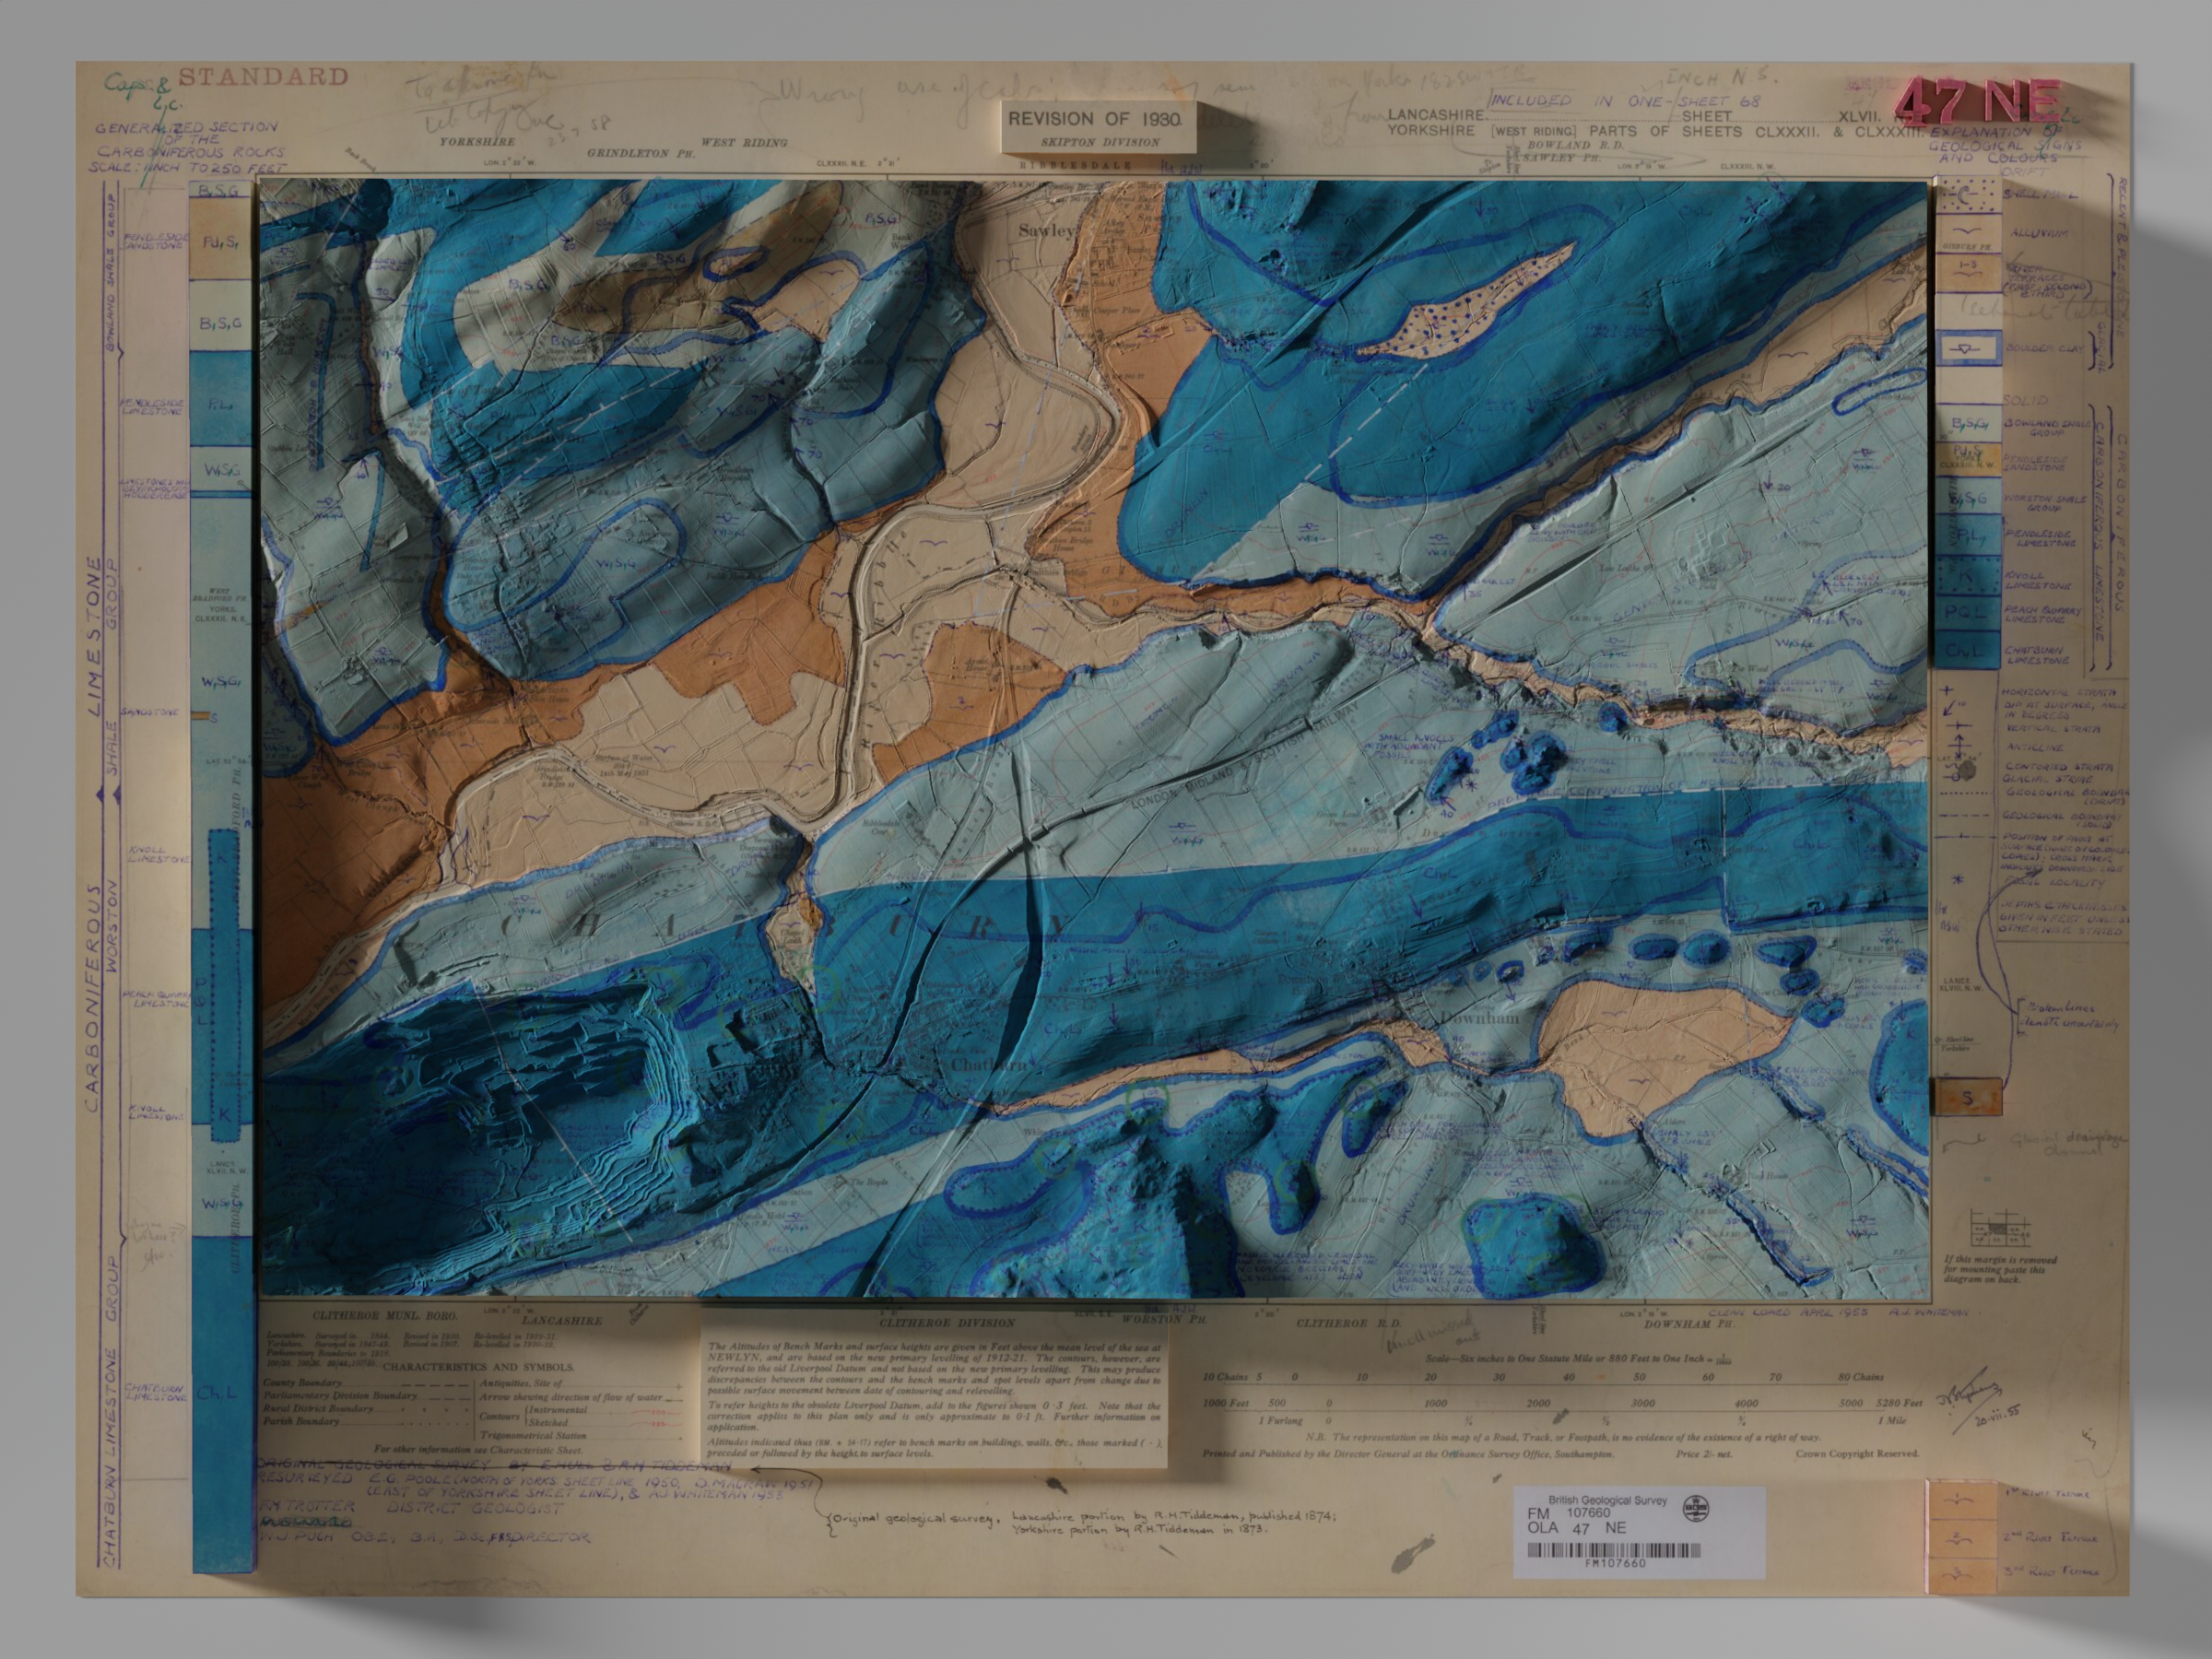

This render uses the 1m open source Lidar data for the UK coupled with a 1932 geological survey map as an overlay texture.